As much as people argue about geotagging and outdoor overuse, I’ve never seen someone bring the receipts on whether Instagram is actually “ruining” the outdoors. So I decided to do a bit of research and see if the narrative has any data to support it.
Before we can dig in, it’s important to review Instagram’s timeline. The app launched in 2010 and sold to Facebook and expanded to Android phones in 2012. The word “latergram” became a part of basic vocabulary in late 2013, and Instagram user counts have only grown consistently, with the fastest acceleration in the back half of the 2010s.

So with that out of the way, are we even in a hiking boom? Yes. Pretty much every country I’ve looked at has seen a surge in hiking and hiking-footwear related search history. The only exception I’ve found is Germany. I assume there was no one left to convert. Here’s the nationwide search history on the word “hiking.” The curves for “hiking boots” basically mirrors it as well:

I also pulled similar searches for Seattle, and the curve is even more drastic, likely because the population of the Seattle metro area was growing simultaneously.
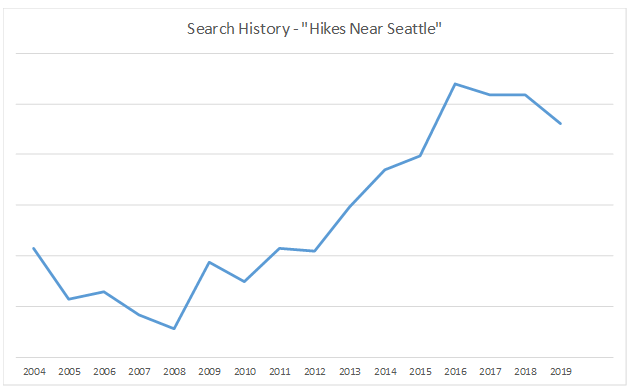
But while social media users and screen time have continued to grow into 2020, we’ve seen hiking start to flat line and even decline, which means Instagram likely isn’t solely responsible for the surge in the first place. There are probably other factors like:
- Wild, by Cheryl Strayed, came out in 2012 in print, followed by the movie adaptation in 2014. And while there have always been nature-themed books and movies, the main character uses her time on the trail as a backdrop to her odyssey with mental and emotional health. For the most anxious and depressed generations of all time, we love some healthy coping mechanisms.
- Millennials and Gen Z are keenly interested in exercise, and prefer social workouts and activities. These gens also known for preferring experiences over things, loving to travel, and opting for micro-vacations that are cheaper and less disruptive to our work schedules.
- Outdoor advocacy and affinity groups are becoming more aware about how their Boomer participants and donors are starting to age out. They’re launching Millennial and Gen Z-focused marketing campaigns (that are also active on social channels) and working to diversify their bases.
- Databases like AllTrails and WTA have made information and trip planning resources so much more accessible.
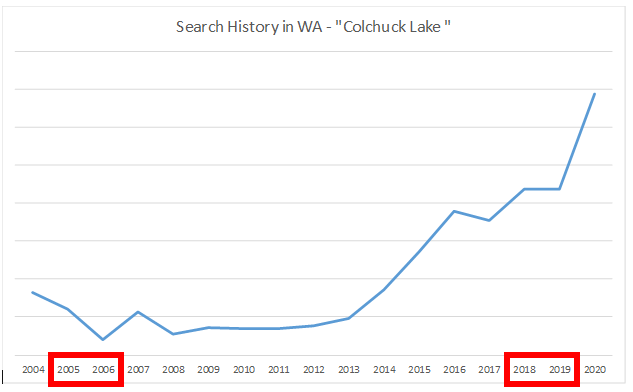
But not all locations are impacted by the uptick equally. Some have seen extreme changes in search traffic, while others have defied the trends and ramped down the past 15 years. I took a bunch of destinations (mostly trails, but a few parks and outdoor travel towns) to see how travel has changed over time. I looked at the ratio of search traffic in the 2018-2019 timeframe (since most destinations were down drastically in 2020, likely due to COVID19), and divided it by the traffic over 2005-2006 (because 2004 data looks really inconsistent).
I also included a few general search terms, limited all queries to Washington state, and added the overall search frequency for all of the hiking destinations.
I also found the number of hashtags with the destination name (like #tolmiepeak). This isn’t the same as a geotag, but it’s the best proxy we’ve got for geotagging habits.
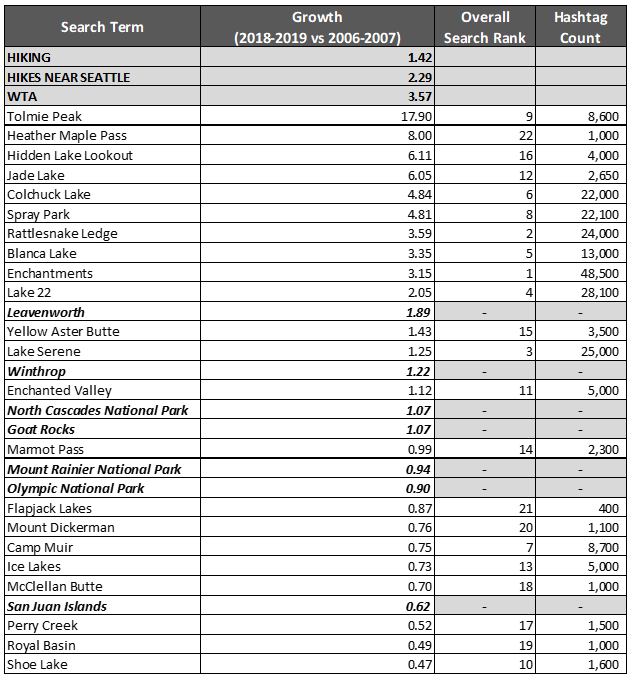
Quick summary of what you’re seeing here: Hiking related searches in WA are up 42%, “hikes near Seattle” is up 129%, and searches for WTA are up 257% compared to ~15 years ago. Tolmie Peak has seen the most drastic increase in search traffic, with almost 18 times the number of searches. Searches for Shoe Lake and Royal Basin have fallen by over half. The Enchantments, Rattlesnake Ledge/Ridge, and Lake Serene are the most frequently searched hikes. Heather Maple Pass and Flapjack Lakes are the least frequently searched.
There are some interesting trends, namely that travel and exploration are moving north and east. Winthrop, Leavenworth, and the North Cascades National Park have all seen increased traffic, and the “viral” hikes that saw the biggest jumps in search tend to be in those directions. There’s definitely a chicken-and-egg question of whether trail traffic is a side effect of a tourism increase, or if the trails are the ones diving the growth. Meanwhile, the Olympics are getting less popular. Could it be a Twilight effect? Timing checks out.
But the most interesting numbers came from running a few correlation stats. There’s a really strong correlation between the search rank and the hashtag count. No surprise; popular hikes are searched a lot, hiked a lot, and tagged a lot. But there was essentially no correlation between tag counts and search increases. Basically, there’s no explanation why 1,000 tags drives up traffic for Heather Maple Pass, but not Royal Basin.
But whether the “hike spike” is caused by Instagram or something else, some delicate spots are getting overused, trash is becoming a problem, parking faux pas block search & rescue access, and it’s hard to sense the wilderness with large crowds. Safety and ecosystem health are important and should be protected. Protection has generally been administered by trail regulations set by land managers, as well as science-based recommendations and education by the Center for Leave No Trace. But more recently, conversation has gravitated towards geotagging.
Visit Jackson Hole started the first “Tag Responsibility” anti-geotag on Instagram as part of an 8 prong sustainability strategy. As search velocity has grown for the region (+74% vs. 15 years ago), they asked that people use a generic tag for the local area vs. pinpointing exact locations.
Since, a handful of copy cats have popped up. They’re almost all in the US, save for two barely used tags in Bellamonte and Vancouver Island. But it’s important to clarify why they’re different than Jackson Hole’s original campaign. Jackson Hole’s anti-tag was started by their local tourism information center, who are clearly coordinated with local land managers in the surrounding area. The valley is 715 square miles in size, is home to 10,400 people, and plays host to 2.6 million visitors per year, with search trends suggesting that they come from coast to coast. The average visitor staying one or more nights spends an average of $675 per visitor, which for context, is $100-200 cheaper than the average Cape Cod, Las Vegas, or Orlando vacation, but 2.5 times the amount for the average Bend, OR or Sedona, AZ trip. It’s still gatekeeping, but the impact is different when you’re talking about fairly well off, out of state visitors in an insanely tourist-heavy area.
The other tags are different. They’re everyday social media users who created them on their own whim. A few have phone numbers associated with the tags. One has an address at an Orlando apartment building. They’re not an authority on whether areas are being overused. The majority of the tags span entire states. Washington’s 100 times larger than the Jackson Hole region, California’s twice as large as Washington. And given that the vast, vast majority of people researching and visiting Washington trails are Washington residents, these “Tag Responsibly” tags are effectively trying to gatekeep the entire state from our neighbors. That’s a problem. All Washingtonians pay taxes. They vote. They see your petitions about logging plans at your favorite trail, and they may sign them, may not. I won’t try to argue that geotagging carries any moral value, but movements to suppress geotagging statewide are unwise. I personally don’t think Instagram is the primary driver the uptick in hiking, but if I did think it was a primary source for information gathering, I’d want the people protecting and funding public lands to know them well enough to find them worthy. WTA has over 3,000 trails in their database (and it’s definitely not exhaustive), and the state of Washington has about a million hikers taking 14 million outings per year, meaning the average trail sees 300 visitors per month. Some of those trails are more like Discovery Park (they get over 20,000 visits per month), while others rarely see a soul. Overall capacity isn’t the issue, it’s about allocation and infrastructure. And the good news is that there are creative solutions to both of those hurdles:
- We need to talk about AllTrails. When I started this research, I didn’t expect to become anti-AllTrails. The anti-geotag crew is like “people should do some research!” but I think one of the primary research tools kind of sucks. While hashtag counts weren’t strongly correlated with traffic increases over the past 15 years, there was a strong correlation with traffic increases and the AllTrails ranking. AllTrails serves up their recommendations based on popularity. Rankings don’t change often, and they literally label those recommendations as the “best trails in Washington.” Users are susceptible to that kind of language (even if Lake 22 is sitting in the top spot). WTA, on the other hand, defaults to sorting by most recent update. One or two hot spots tend to pop up on the first page due to their update frequency, but there’s arguably more diversity and the rankings are constantly changing so that all 1 million Washington hikers don’t see the same list over the course of a week. But my beef doesn’t stop there. AllTrails is a privately held, for profit tech company funded through private equity to the tune of $80 million dollars since their 2010 launch (for context, WTA operates off of $3-5M of revenue per year). There is no incentive for public lands advocacy (they’ve said nothing over issues like Bear’s Ears or the gutting of NEPA). There’s no ROI in teaching the 10 Essentials, Leave No Trace Principles, trail etiquette or permit requirements. And likewise, there’s no benefit to investors to spread hikers out and suggest unique destinations with scant review coverage. They juice a handful of spots on free, public lands to sell app downloads and don’t do shit for those land management agencies on the back end.
- But trail research algorithms could be really cool. Imagine WTA got feedback from land managers when trails got too busy – major trash issues, trail and parking traffic that blocked emergency services, etc. They match up those overcapacity weeks with the number of page hits they got on those trails, and then put “nudges” in place whenever page hits surge. So, say for example, the weeks that forest managers report overcrowding on Colchuck largely have 50,000 page views during the week, leading up to the weekend. WTA could set rules to show a pop up conveying that “Colchuck is forecasted to be so busy this weekend that land managers are worried about hiker safety and ecosystem health” and provide a few alternatives that are comparable, or maybe a few of the items on the user’s hiking list that are forecasted to be less busy than normal, like “This is actually a good weekend to check out Lake Valhalla. We’re predicting it’s going to be a lot less busy than usual.”
- And it’s important to remember that trail capacity can be improved. The Forest Service hasn’t gotten much of an increase in funding in decades, and firefighting costs have skyrocketed over that time. Increased funding could accomplish a lot. Imagine there’s ranger presence at the Colchuck parking lot every weekend who can turn people around when there’s not room to park safely or when they bring dogs along for the hike. Or that there was bandwidth to issue citations to all the groups who hopped the restoration signs for a mid-meadow Rainier pic. Imagine trailhead trashcans and bathrooms were in serviceable condition. Imagine trail maintenance never had to be deferred due to funding, making trail traffic less impactful to the local environment. Not every trail is equally fragile and delicate, in part due natural terrain features, but also strategic design features and regular maintenance.
- Day-hike permitting isn’t ideal, but it’s free. Without funded programs and buy in from online trail research partners, the Forest Service doesn’t have many other options to manage traffic. It’s not unheard of – see St. Helens, the Wave in Vermillion Cliffs National Monument, the Subway at Zion, Mount Whitney. Other than the extremely constricted locations (the Wave allows 10 people per day), most locations allow people to get access once or twice a season, which is probably sufficient for the few very popular, yet fragile locations.
